
Analysis of $18 billion in software spend reveals price variability as the most underutilized negotiation signal, with DocuSign showing 111% pricing spread where some companies pay half what others pay for identical contracts. High-variability vendors like DocuSign, Box, Clari, HubSpot, and Okta with 40%+ spreads warrant priority negotiation effort bringing benchmarks and competitive intel. Medium-variability vendors including Salesforce and Google Workspace require focus on uplift caps and contract terms. Low-variability vendors like Figma and Articulate showing 0% variance should redirect effort toward payment terms and usage optimization rather than discount requests, as AI-native tools demonstrate pricing discipline while traditional SaaS platforms fight to retain wallet share.
Imagine walking into a dealership and every customer is paying a different price for the same car. Some are paying full sticker. Others, 20% off. A few, somehow, are driving away with a free maintenance plan.
Anyone who has ever bought a car at a dealership knows those discounts are extremely unrealistic. But when you buy software, that’s exactly what it looks like.
The game is rigged differently for every supplier. Some are engineered for flexibility - sales reps with discretion, frequent pricing inconsistencies, margin expectations that shift quarter to quarter. Others run operations so tight that asking for 5% off is met with a polite “that's not how we work.”
If you’re walking into renewals treating Hubspot the same way you treat Figma, you’re leaving serious money on the table.
What Drives Price Variability
Price variability stems from four forces:
- Competitive pressure in the category: When alternatives exist and switching costs are manageable, vendors have incentive to move. CRM and collaboration tool markets are crowded, developer tools less so.
- Sales team autonomy: Some vendors empower reps to discount. Others enforce strict pricing through centralized deal desks. The more distributed the decision-making, the more variability you'll see.
- Pricing model maturity: Younger companies still figuring out packaging will show more variance. Established platforms with transparent tier structures show less.
- How aggressively vendors are pursuing growth vs. margin: Fast-growing AI-native tools are less flexible. They're getting customers regardless. Legacy SaaS platforms losing market share are more flexible. They need you to stay.
Right now, with AI reshaping categories and vendors scrambling to either bolt on features or defend against AI-native competitors, pricing strategies are in flux. That's creating negotiation windows that didn't exist 18 months ago.
The Price Isn’t Right
Our analysis of over $18 billion in software spend reveals something finance and procurement teams need to see: price variability is the single most underutilized signal for where your negotiation effort should go, plus where real savings opportunities lie.
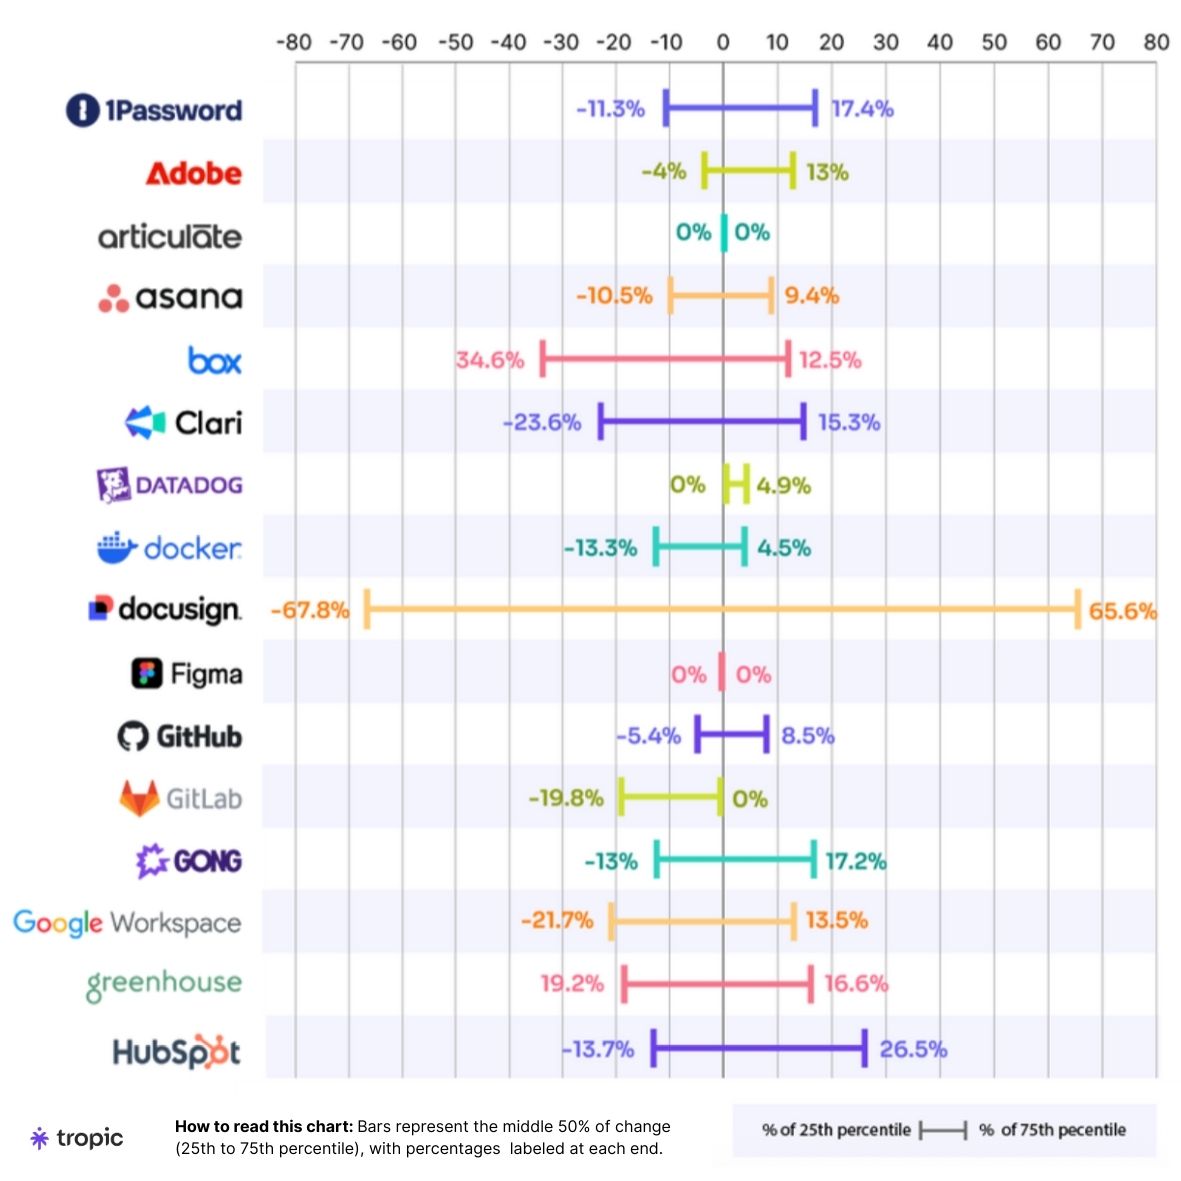
Take DocuSign. The pricing spread from the 25th to 75th percentile is 111%. Translation: some companies are paying nearly half of what others pay for identical contracts. Not different features. Not different volumes. The same product.
Meanwhile, Figma shows 0% variability. Articulate? Also 0%. What you see is what you get, and no amount of relationship-building or "strategic partnership" talk will move that number.
Between those extremes sit the vendors most teams actually spend real money on:
- HubSpot: -11% to +24% (35-point spread)
- Atlassian: -16% to +27% (43-point spread)
- Okta: -28% to +14% (42-point spread)
- Google Workspace: -14% to +14% (28-point spread)
- Salesforce: -17% to +17% (34-point spread)
Here’s how price variability data stacks up for some other top suppliers:
How To Interpret Price Variability
Treat price variability like a compass for negotiation ROI. Price variability data tells you:
- Where to lean in
- Where to hold the line
- Where your capital is at risk of spoilage (operational waste)
In other words, it shows you exactly where deploying your best tactics will actually move the needle and where you're better off redirecting that energy.
The “Definitely Negotiate Here” Category
- DocuSign remains the variability champion. With a pricing spread from -68% to +66%, this 134-point range tells you everything you need to know: negotiation outcomes here vary wildly. Most teams think they've already maximized their leverage. But our data shows some companies are paying less than half of what others pay for identical contracts. If you're not benchmarking DocuSign deals against peer pricing, you're almost certainly overpaying at scale.
- Box and Clari show similar high-variability profiles at -35% to +13% and -24% to +15% respectively. Both vendors operate in competitive categories with alternatives that create meaningful leverage. These are exactly the types of renewals where bringing competitive intel and peer pricing data to the table can shift outcomes by tens of thousands of dollars.
- HubSpot's variability tightened but still offers meaningful room at -14% to +26% (40-point spread). Despite recent pricing model changes and bundling pressure, HubSpot remains open to personalized deals. Lock in favorable pricing now before forced migrations eliminate your options.
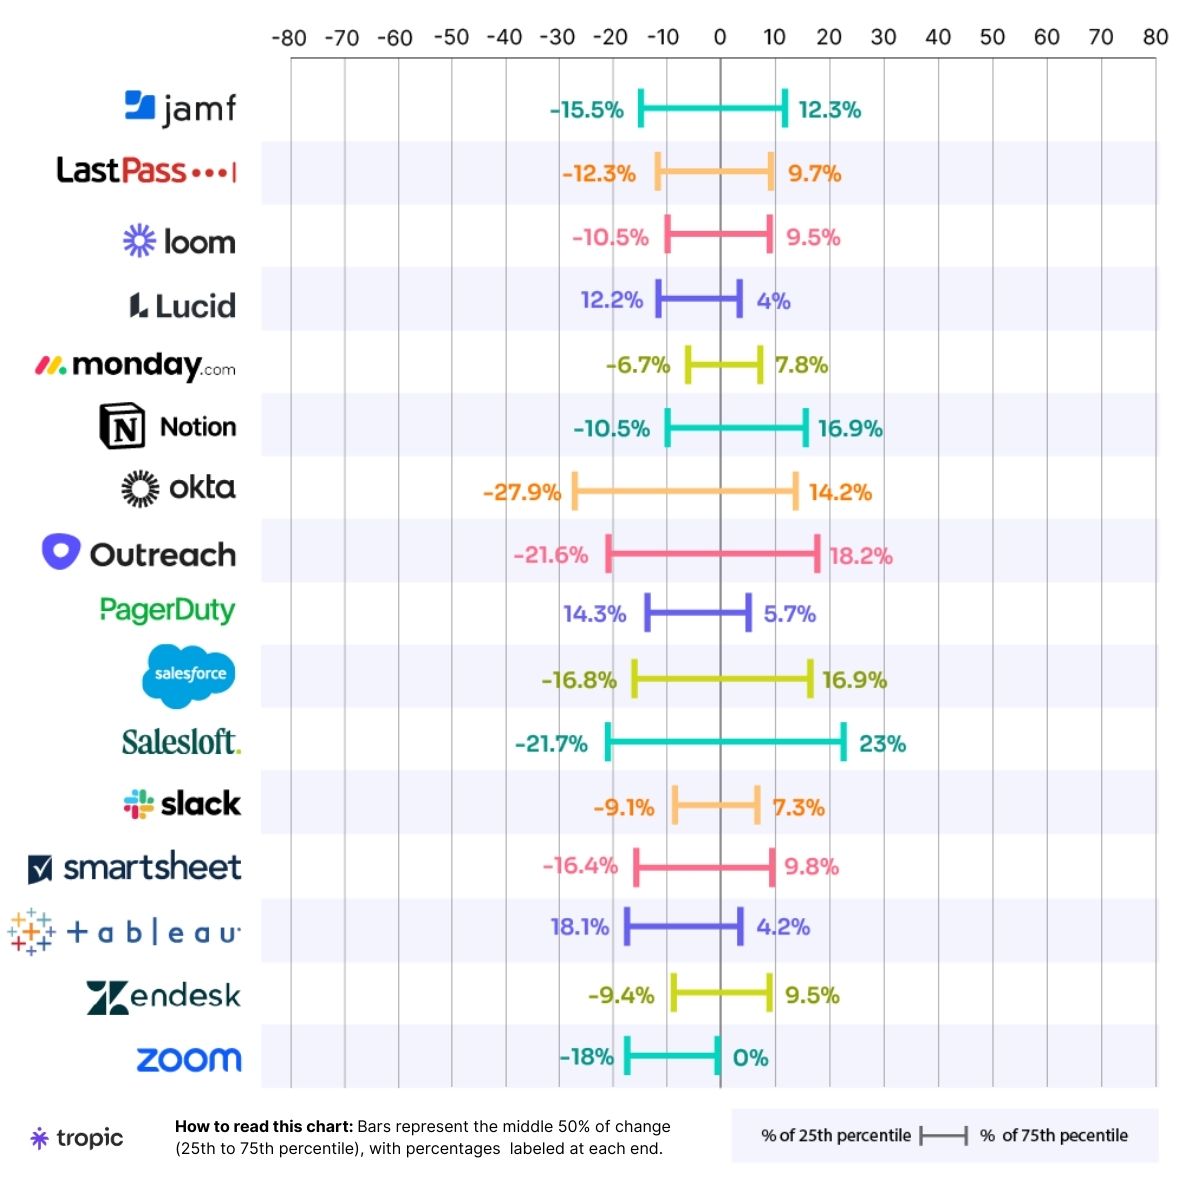
- Okta presents a 42-point spread (-28% to +14%), making it one of the higher-priority security tool renewals. Given Okta's central role in identity management, even small percentage gains compound across large user bases. This is where volume leverage and competitive alternatives (Auth0, Microsoft Entra) create real negotiating room.
- Google Workspace and Salesforce both hover around 30-35 point spreads (-22% to +14% and -17% to +17% respectively). These foundational platforms touch nearly every team in your organization, which means small percentage improvements translate to significant budget impact. If your team isn't anchoring renewal conversations against the 25th percentile for these vendors, you're leaving potentially six figures on the table annually.
The Middle Ground: Where Tactics Matter More Than Price
- Slack's variability sits at -9% to +7% (16-point spread), but here's what changed in 2025: Salesforce's acquisition tightened pricing discipline significantly. They're enforcing 9% year-over-year uplifts at renewal unless you demonstrate 15-20% user growth. The negotiation game shifted from discount percentage to uplift caps and legacy tier protection. Many customers are being forced into the new Enterprise+ bundle that consolidated previous Select and Grid tiers - with list prices jumping from $20-32/user to $45/user. Your leverage here isn't about moving price; it's about contract terms that protect against these forced migrations.
- Adobe's -4% to +13% range (17-point spread) puts them in a similar zone. The window is tighter than DocuSign, but it's wide enough to matter. This is where bundling Creative Cloud with Document Cloud, negotiating multi-year commitments in exchange for price protection, or co-terming multiple Adobe products creates leverage that pure discount requests won't.
- GitHub and Datadog show narrow bands at -5% to +9% and 0% to +5% respectively. For these vendors, the negotiation shifts from "can we move the price?" to "how do we structure this intelligently?" Focus on usage-based pricing caps, overage protection, and consumption forecasting tools. Datadog especially presents spend variance challenges - our data shows they're one of the top drivers of budget overruns due to consumption-based pricing unpredictability.
The "Don't Waste Your Time" Category
- Figma and Articulate both show 0% variability. What you see is what you get. Full stop. These vendors have made a strategic decision to operate with transparent, uniform pricing. Spending three weeks trying to squeeze an extra 10% out of Figma is procurement theater - it creates internal frustration and vendor friction without moving outcomes.
- LinkedIn falls into similar territory at -4% to +3% (7-point spread). Minimal flex. The LinkedIn playbook is different: negotiate tier boundaries, seat utilization tracking, and prevention of shadow spend where teams expense it individually rather than going through procurement.
- Lucid, PagerDuty, and Tableau show similarly tight bands in the 8-16 point range. These aren't necessarily bad vendors - they're just vendors where pricing strategy won't differentiate your deal. Operational efficiency, usage optimization, and integration strategy become the value levers.
Important to note, this doesn't mean these contracts can't be optimized. Shift your focus to:
- Payment terms (annual vs. multi-year)
- Auto-renewal clause modifications
- User addition and reduction flexibility
- Implementation support and training credits
- Proration rights when scaling down
Low Variability Can Also Mask a Different Problem
Just because pricing looks flat doesn't mean the contract is fair. Many companies overbuy seats, misalign tier levels with actual usage, or fail to rightsize as teams shrink.
We're seeing this especially with tools purchased during 2021-2022 growth phases that haven't been reevaluated post-layoffs. A renewal at "flat pricing" might still represent 40% more spend than you need if you're sitting on 200 unused licenses.
The question to ask: “Are we comparing like-for-like, or are we locked into tier levels and volume commitments that no longer match our business?”
AI’s Impact on Price Variability
Buying trends from our dataset also show something critical: traditional SaaS vendors are showing more pricing discipline while AI-native tools are showing less flexibility.
Why? AI tools like Cursor, Anthropic, Clay, and Synthesia have grown (by contract count) ~200-600% year-over-year. They don't need to discount. Traditional platforms are fighting to keep wallet share as companies consolidate spend. They're more willing to negotiate.
Price variability is being reshaped by AI in two distinct ways:
- AI-Native tools show unpredictable patterns: Vendors like Cursor, Anthropic, and OpenAI don't have enough historical pricing data to show stable price variability yet. They're still figuring out packaging, still experimenting with credit-based pricing models, still adjusting to enterprise demand. That creates both opportunity (they need reference customers and case studies) and risk (pricing can jump dramatically at renewal).
- Traditional vendors are weaponizing AI for pricing leverage: The "AI tax" is real. Initial renewals are coming with 20-37% uplifts, justified by AI premiums and functionality. But the pattern we're seeing that teams that negotiate early with benchmark data are landing at ~12% uplifts instead of 30%+. That's the difference between a $250K renewal becoming $280K vs. $330K - a $50K swing on a single negotiation.
Some price variability is artificial, driven by opaque credit systems, consumption-based obfuscation, and experimental AI pricing schemes.
You need to be savvy enough to decode these patterns and put pressure on suppliers to simplify or accept that the forecasting buffer needs to expand for certain categories.
All of this matters because your renewal calendar will look very different. The tools you bought 18 months ago have changed their pricing models, bundled in AI features, and reset list prices. If you're using last year's benchmark data, you're already behind.
How Buyers Should Use Price Variability Data Right Now
Use price variability as a prioritization filter, not just a negotiation tool.
Step 1: Tier your vendors by variability potential
Group renewals into three buckets:
- High variability (40%+ spread): Priority effort. Bring benchmarks, competitive intel, and time.
- Medium variability (15-40% spread): Standard negotiation. Focus on bundling, term alignment, co-terming.
- Low variability (<15% spread): Light touch. Optimize terms, not price. Redirect energy elsewhere.
Step 2: Match tactics to the vendor's flexibility profile
For high-variability vendors like DocuSign, Box, or Okta:
- Anchor negotiations 6+ months before renewal
- Use peer pricing data to establish realistic targets
- Explore tier shifts, bundling, or term extensions as levers
- Be willing to walk if pricing doesn't move toward benchmarks
For medium-variability vendors like Salesforce or Atlassian:
- Focus on commercial terms - auto-renewal clauses, proration rights, downgrade flexibility
- Co-term multiple products to create leverage
- Negotiate uplift caps aggressively (these matter more than one-time discounts)
For low-variability vendors like Figma or LinkedIn:
- Stop trying to move price - you won’t get anywhere.
- Negotiate payment terms, implementation support, or user add-on rates instead
- Document their pricing model internally so teams don't waste time next cycle
Step 3: Build variability into your capital planning
When finance is building the budget, don't just forecast "SaaS spend up 8%." Break it down by vendor flexibility. High-variability categories should have embedded savings targets. Low-variability should reflect realistic growth curves. This turns procurement from a discretionary cost function into a strategic capital allocator.
Let This Data Direct Your Attention, Effort, and Dollars
Vendors are more aggressive. Pricing models are more complex. AI has scrambled the stack. And your renewal calendar is only getting more dense.
Time and information remain your two most valuable assets.
Start early. Use data. Prioritize effort where variability exists. And for the love of working capital, stop spending three weeks trying to move Figma's pricing.
Procurement is often seen as a cost center. But with the right insights - like price variability - it’s a strategic function that can unlock margin, resilience, and optionality.
For more data like this, grab our full Spend Report here.

Related blogs


Drive savings and efficiency at any stage
Discover why hundreds of companies choose Tropic to gain visibility and control of their spend.