
Introduction
The line between SaaS and AI is blurring, and that's making software buying more complicated than ever.
Twelve months ago, the question was whether AI tools were worth the investment. Today, the question is which AI tools, from which vendors, at what cost. Legacy SaaS providers are racing to bolt on AI features, while AI-native companies are scaling fast enough to show up on everyone's renewal calendar. This is all creating a software market in transition, where the rules of procurement (and budgeting and pricing) are being rewritten in real-time.
For this report, we've analyzed patterns from over $18B in spend under management to understand how AI is reshaping software budgets and in other ways, how it’s not changing everything as much as we may think.
- We've broken down some of our analysis by use of AI —AI-Native, Hybrid SaaS + AI, and Primarily SaaS—to see where dollars are actually flowing.
- We've also grouped companies into two cohorts: SMB/Growth (1-250 employees) and Mid-Market/Enterprise (251+ employees) to surface clearer patterns.
What we found:
- AI spend is growing exponentially, but the long tail hasn't fundamentally shifted yet.
- Your top 10 suppliers still dominate your budget.
- Vendors are getting more aggressive about AI pricing.
- What continues to remain a truth we will always stand by, the companies that are winning at procurement aren't just negotiating harder, they're negotiating earlier with the right insights by their side.
Now, a few predictions for 2026 that we’re seeing stem from the analysis
(We'll check back in December to see what we got right)
We're only going to see more consolidation among suppliers, especially Primarily SaaS vendors acquiring young, AI-Native competitors or complimentary services to accelerate their product roadmap. 2025 ended with many of these — Grammarly and Superhuman, Salesforce and Qualified, and most recently, Snowflake and Observe.
1AI-native tools are already moving from experimentation to core infrastructure. By year's end, engineering and GTM teams will see their stacks completely transformed as these tools become essential rather than experimental line-items.
2Credit-based and consumption pricing will become the default for new AI tools, making benchmarking and forecasting significantly harder.
3Expect vendor pushback on short-term contracts as AI-native suppliers mature and seek predictable revenue.
4
Average Spend
by Company Size + AI Category
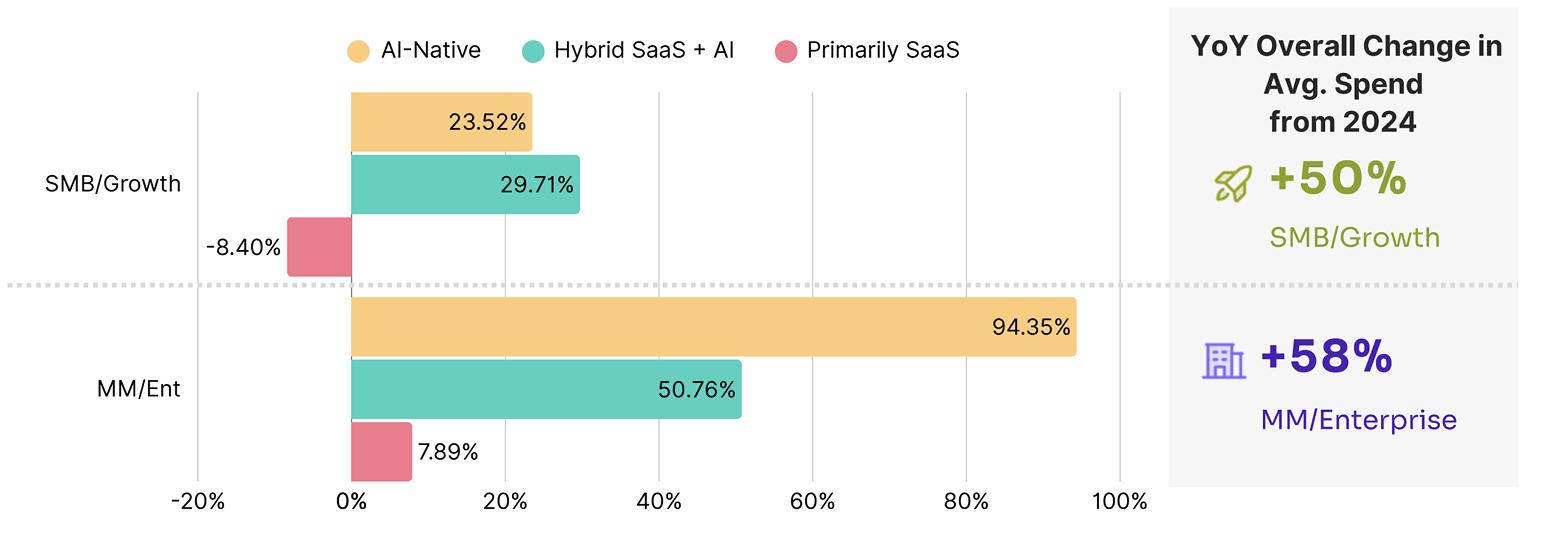
YOY Change In Average Spend by AI Category

Market Insights
Spending is going up. SMB/Growth companies saw average spend increase 50% YoY, while Mid-Market/Enterprise jumped nearly 58%. But the real story is in the breakdown by AI category:
- For Mid-Market/Enterprise: AI-Native spend grew 94% YoY, nearly double the growth rate of Hybrid tools (51%) and dramatically outpacing Primarily SaaS (8%). Companies are placing serious bets on purpose-built AI solutions, not just AI features tacked onto existing platforms. But, with company lock-in at the enterprise level, SaaS companies are still growing slowly.
- For SMB/Growth: The pattern is similar but more measured, AI-Native up 24%, Hybrid up 30%, and Primarily SaaS actually declining 8%. Smaller companies are being more selective, letting go of traditional tools that aren't delivering enough value to justify their place in the stack.
- The takeaway: AI isn't a line item anymore, it's becoming the line item. And traditional SaaS that hasn't meaningfully integrated AI is starting to lose wallet share.

Negotiation Insights
- Calculate your AI layer mix. If more than 30% of your spend is still in "Primarily SaaS" tools, you may be over-indexed on legacy solutions, or you may have negotiation leverage as vendors try to keep you from switching.
- Use the declining growth in traditional SaaS as a signal: vendors in this category are feeling pressure. Come to renewals with competitive alternatives and be prepared to consolidate.
- For AI-Native tools, expect less pricing flexibility, growth is strong and these vendors know it. Focus negotiations on terms like price caps, usage guardrails, contract length rather than discount percentage.
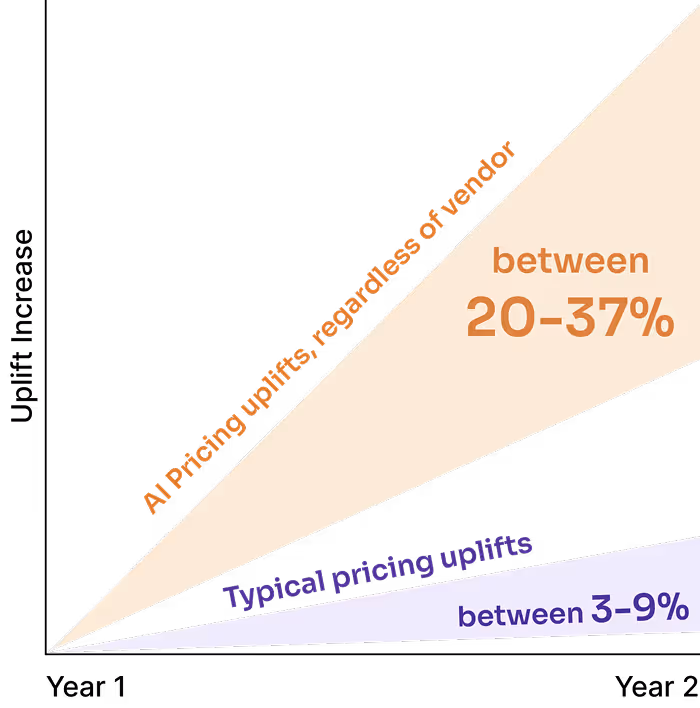
The AI Tax: What You Need to Know
Over the past 12–18 months, a new cost structure has emerged in enterprise software: the AI Tax. Based on real-world renewal data across Tropic customers, we're seeing AI-driven price increases of 20–37%, far exceeding the typical 3– 9% annual uplift. Beyond straight price increases, vendors are also fundamentally changing how they charge for AI via credit and outcome based pricing, making costs harder to predict and benchmark.

Key Takeaways
- Fewer than one-third of companies can tie AI investments to measurable P&L impact. The core challenge: efficiency gains are often captured by employees (better work-life balance) rather than converted into redeployable business capacity.
- Negotiation works. Negotiation reduces these asks by roughly 55% on average. Across deals with flexibility, final uplifts averaged ~12%—down from initial asks of 20–37%. Start renewal conversations 6+ months early, request legacy pricing explicitly, and demand ROI evidence before accepting premiums.
4 Tactics Vendors Are Using to Apply the AI Tax

Forced SKU Migration — Vendors consolidate existing tiers into new AI-inclusive packages, eliminating the option to renew at previous pricing

Unbundling-Then-Rebundling — Vendors break apart all-in-one products into multiple SKUs, then position AI features as premium add-ons required to restore previous functionality.

Credit-Based Obfuscation — Vendors move from predictable per-seat pricing to consumption-based "credit" models that obscure true costs and make benchmarking nearly impossible.

Conditional Discount — Vendors offer discounts on base products only if you agree to purchase AI add-ons, reframing AI adoption as a savings opportunity rather than an additional cost.
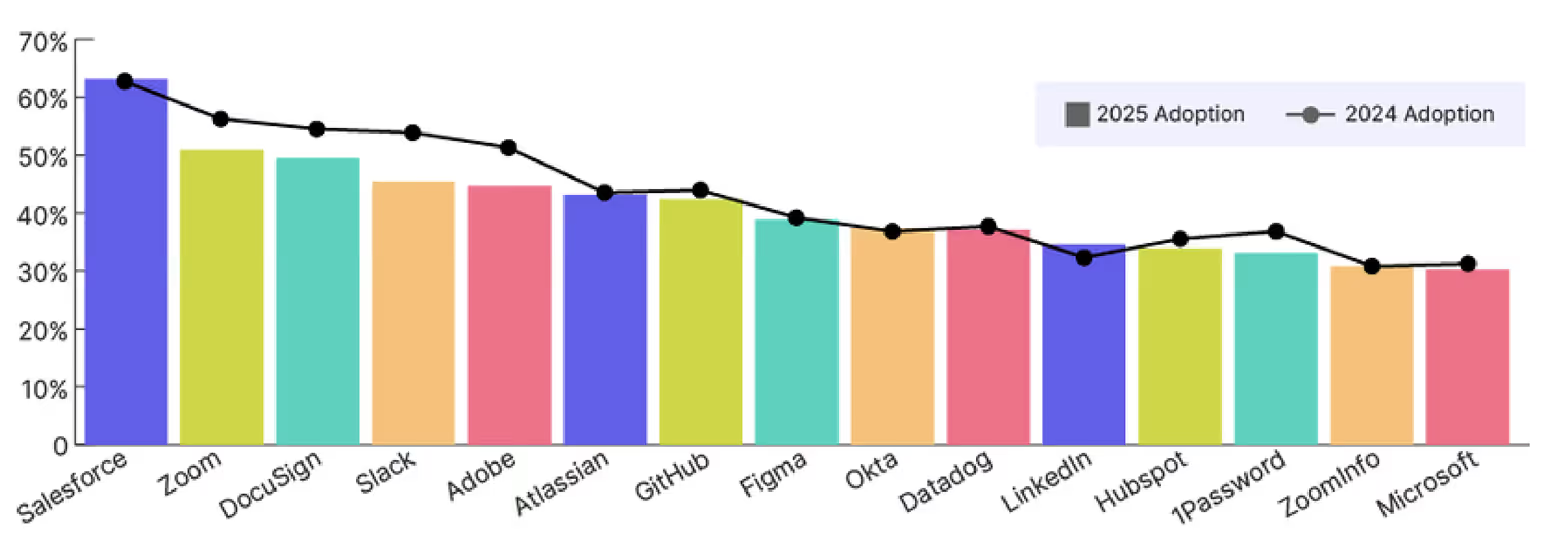
Most Commonly Used Tools
The top of the adoption chart looks familiar—Salesforce, Zoom, DocuSign—but the year-over-year trends tell a more interesting story. Several legacy leaders are showing flat or declining adoption among Tropic customers, while engineering and infrastructure tools continue to gain ground. The slight declines, especially on collaboration platforms, are a clear sign that consolidation efforts are maturing. Tools that enable engineering velocity, design innovation, or infrastructure scale continue to thrive.
Top 15 Suppliers by Adoption Rate
Supplier & Market Insights
- Consolidation is continuing, especially among collaboration tools. We're seeing some decreases in Slack and Zoom in favor of bundled alternatives like Google Workspace and Microsoft Teams. But, don't count these point-solutions out completely.
- Tools that support engineering, product, and infrastructure (Atlassian and Figma) are seeing rapid adoption as organizations prioritize scalability, intuitive UX, and integration.
- Buyers are becoming more selective and ROI driven, security and operations platforms like Okta.
Negotiation Insights
- High adoption ≠ irreplaceable. Tools like Zoom and Slack face real competitive pressure from bundled alternatives, use this as leverage.
- Watch for tools showing declining adoption in your peer set, this is a signal that switching costs may be lower than vendors claim. Ask your vendor directly: "What's your retention rate for companies our size?"
- When exploring consolidation, tie conversations to real business outcomes like reduced overlap, license optimization, or increased adoption.
Pricing Variability for Top Suppliers
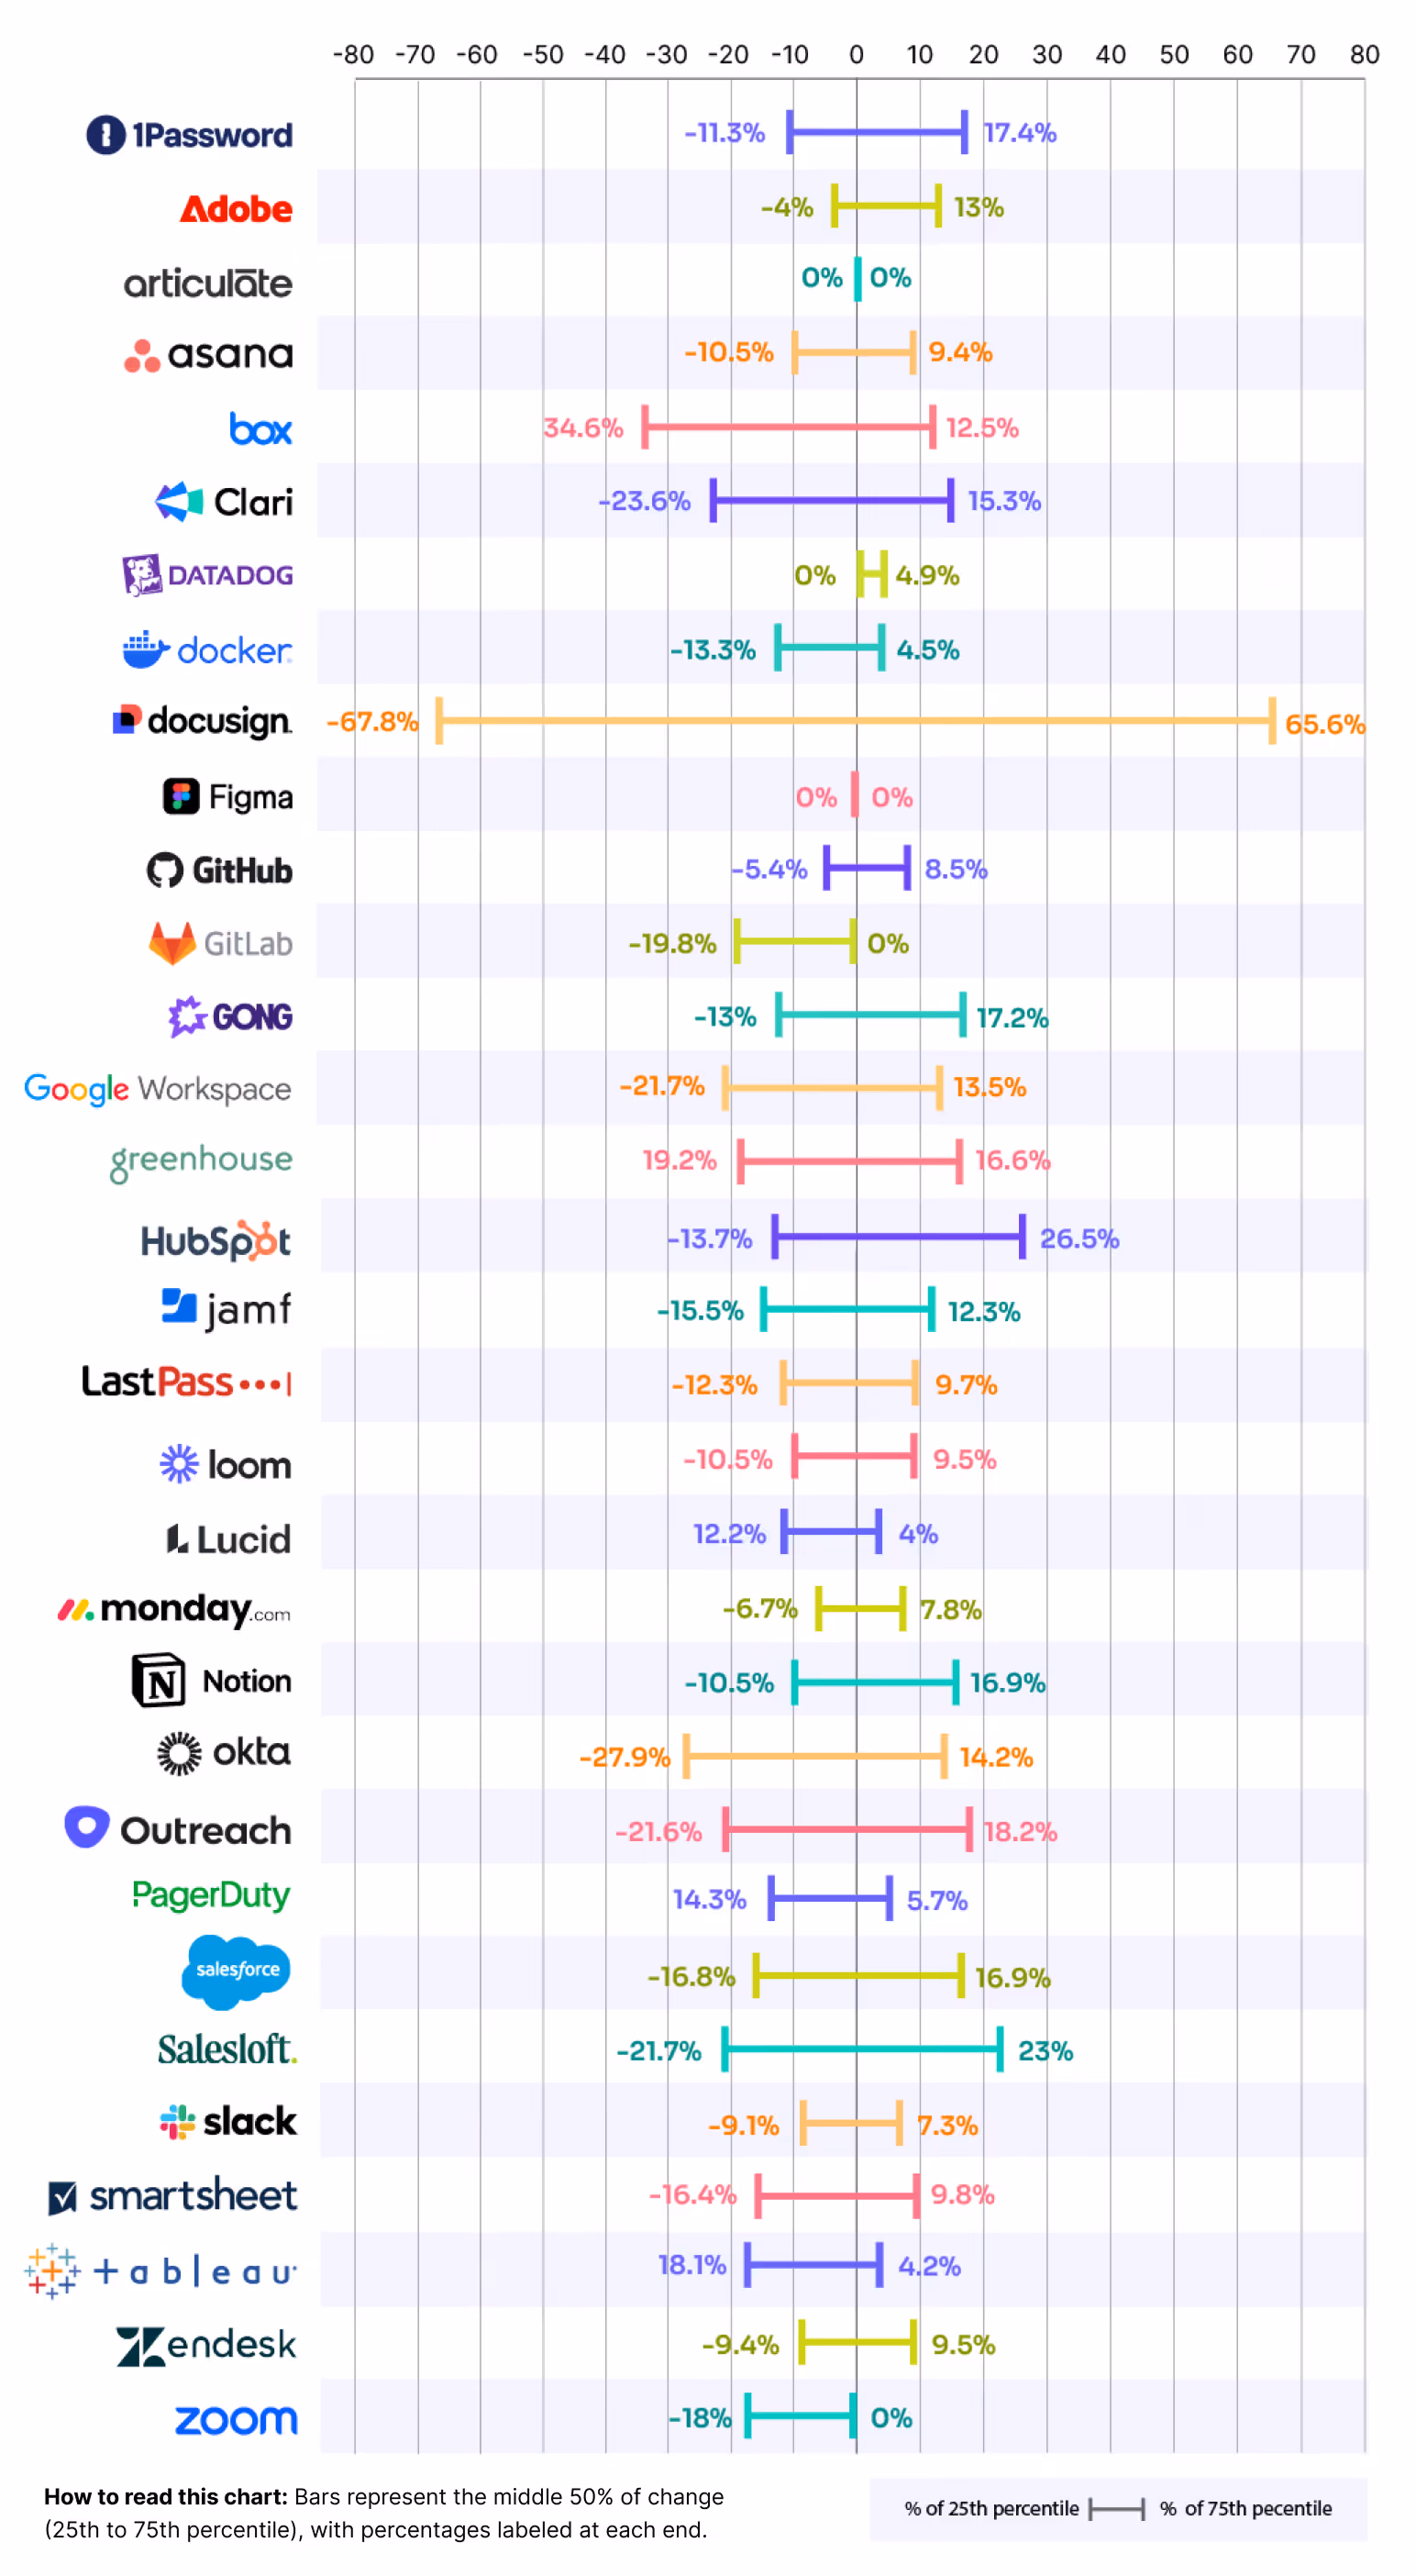
Pricing variability tells you where negotiation effort actually matters. The spread between what companies pay for the same tool can be dramatic, or almost nonexistent.The chart below helps understand this volatility. Bars represent the middle 50% of change (25th to 75th percentile), with percentages labeled at each end.
What drives variability? Generally, it's a combination of competitive pressure in the category, sales team discretion, contract term length, and how aggressively the vendor is pursuing market share. High-variability vendors are often ones facing meaningful competition or undergoing pricing model transitions.
Understanding price variability can help exponentially when you're negotiating and helps you prioritize negotiation effort on high-variability suppliers. For low-variability suppliers like Figma and Articulate, don't burn cycles trying to move price. Focus instead on terms: payment timing, auto-renewal clauses, and user addition rates.
Use variability data to set realistic internal expectations. Telling stakeholders "we should get 30% off Datadog" sets everyone up for disappointment.
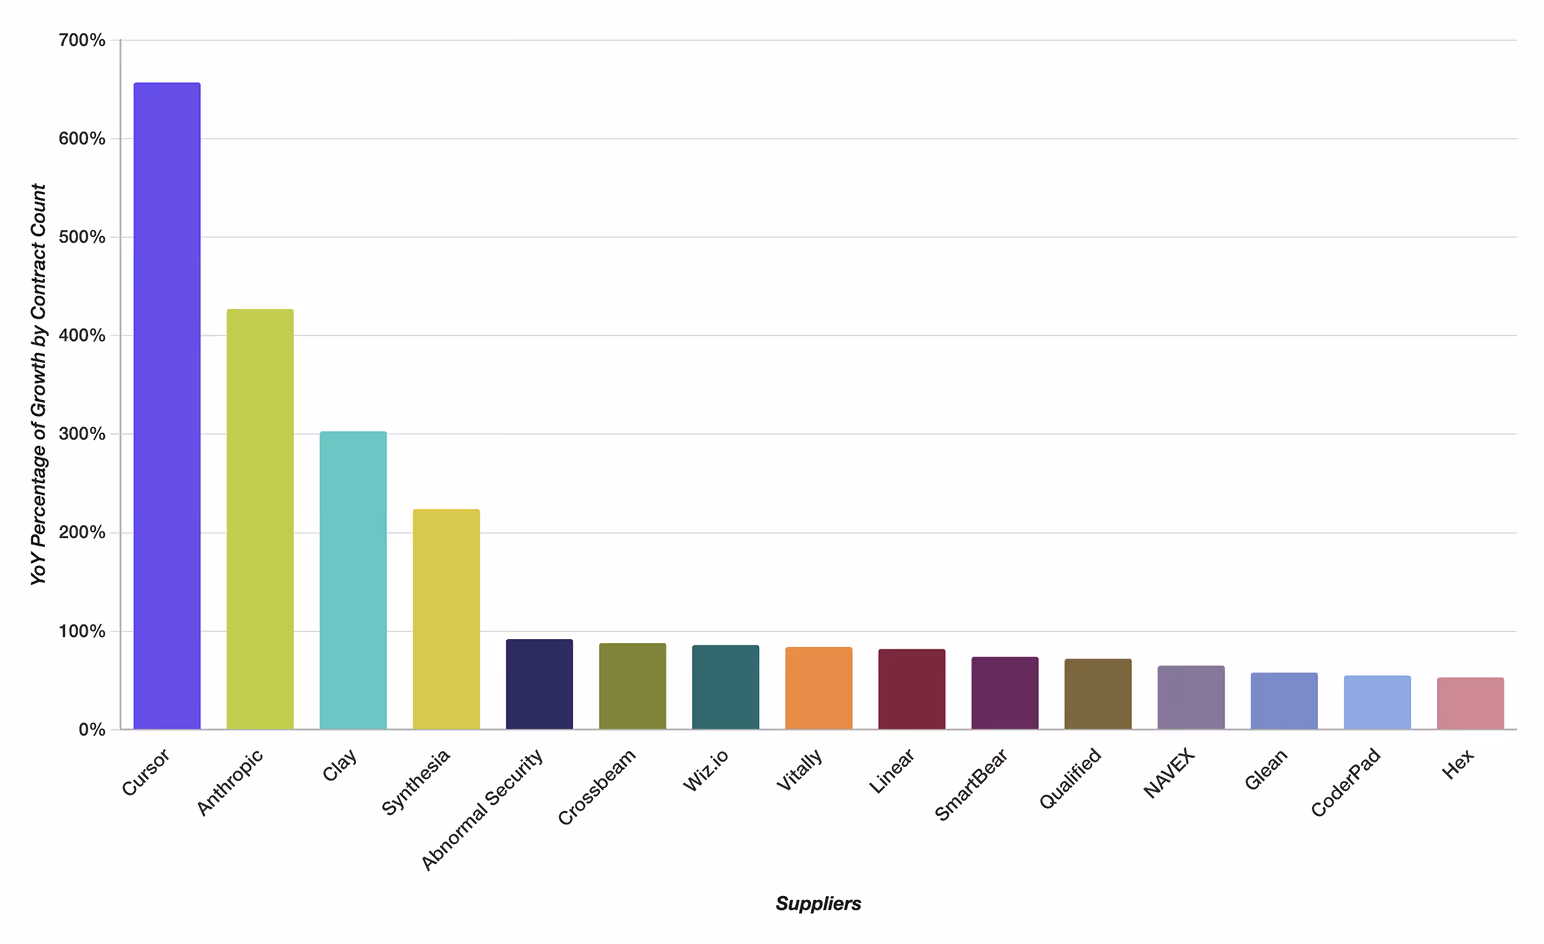
Fastest Growing Suppliers by Contract Count
The top of this list reads like an AI startup portfolio: Cursor, Anthropic, Clay, Synthesia. Notably, OpenAI has dropped off the fastest-growing list, not because adoption is declining, but because their explosive growth phase has leveled into mature, steady expansion. First-mover advantage eventually normalizes.
Beyond AI, we're seeing growth in security (Abnormal Security, Wiz.io) and developer productivity (Linear, SmartBear, CoderPad).The enterprise vs. growth split is tells us:
- SMB/Growth companies are adopting developer-focused AI tools (Sonar, Cursor, Anthropic) and GTM automation (Clay, Orum)
- Mid-Market/Enterprise is prioritizing security (Zscaler, Wiz.io, CrowdStrike, Qualys) alongside AI infrastructure
SMB/Growth
- Sonar
- Anthropic/Claude
- Clay
- Cursor
- CoderPad
- OpenAI/ChatGPT
- Orum
- MUI
- Wiz.io
- SmartBear Software
- ThoughtSpot
- Ramp
- Hex
- Jellyfish
- Virtru
MM/Enterprise
- Cursor
- Anthropic/Claude
- Clay
- Zscaler
- Crossbeam
- Ramp
- Qualified
- Fortra
- Wiz.io
- PortSwigger
- Qualys
- NAVEX
- Progress
- Cognism
- Vanta
Negotiation Insights
- Fast-growing vendors have less incentive to discount. For Cursor, Anthropic, and Clay, focus on locking in current pricing with strong uplift protection rather than chasing discounts you won't get.
- Security tools (Wiz.io, Abnormal) are growing through enterprise land-and-expand. If you're an early adopter, negotiate for enterprise pricing now before you scale into their target sweet spot.
- For "second wave" AI tools (Synthesia, Glean), there may be more room to negotiate as they're still building market share and case studies matter to them.
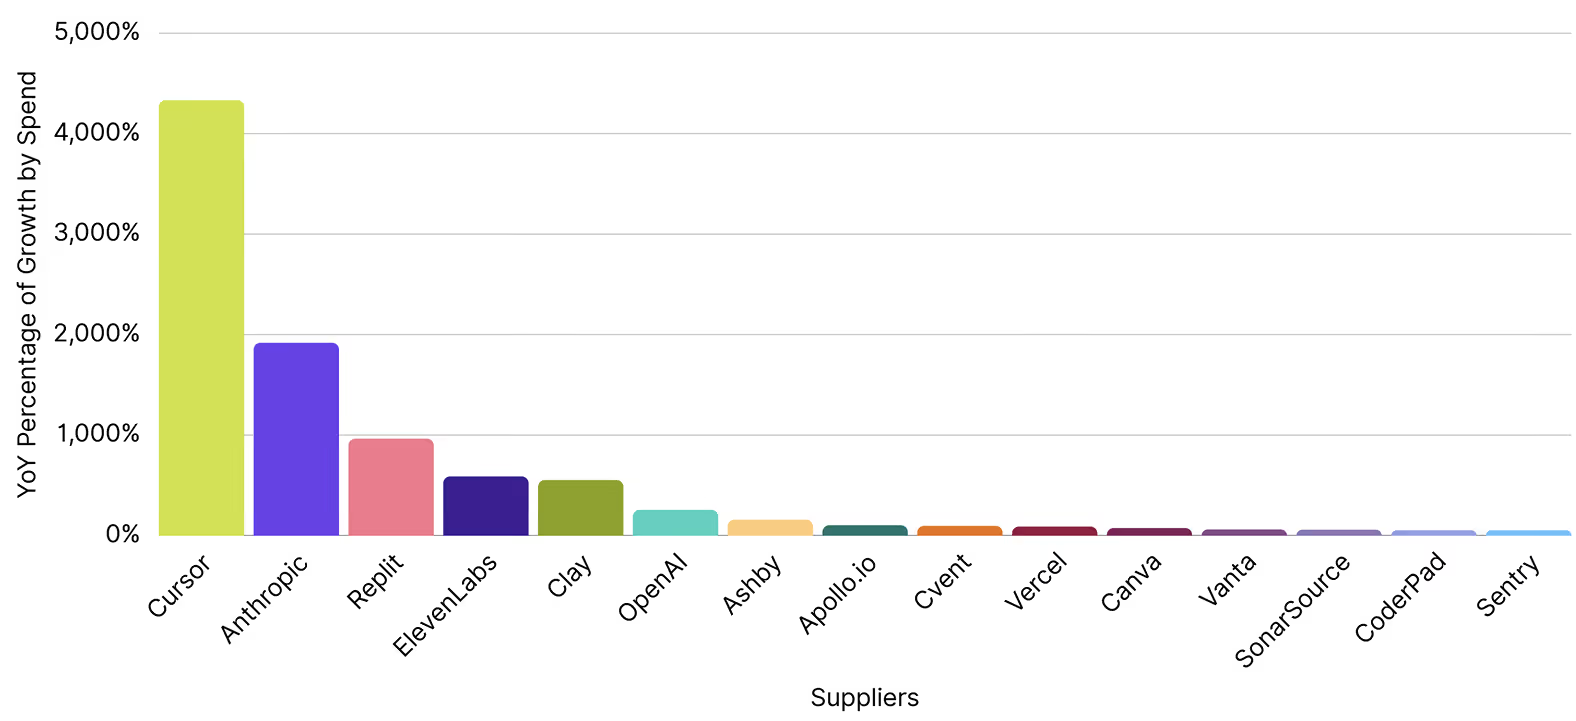
Fastest Growing Suppliers by Overall Spend
The magnitude of spend growth on Cursor and Anthropic are not surprising, but still striking. They're changing a category, that was only just created a couple of years ago.
- The company size split shows different priorities. SMB/Growth is investing in AI-powered GTM, smaller teams using AI to punch above their weight. MM/Enterprise is doubling down on developer experience and content operations.
- Developer tooling dominates overall—six of the top fifteen are engineering-focused. Companies are investing in infrastructure that helps teams build faster.
- OpenAI dropped off the contracts list but remains #6 by spend. New customer acquisition has slowed, but existing customers are spending more. The land-and-expand motion is working.
SMB/Growth
- Anthropic
- Cursor
- ElevenLabs
- Brex
- OpenAI
- Fireflies.ai
- Clay
- Ashby
- Vercel
- Superhuman
- Vanta
- Apollo.io
MM/Enterprise
- Cursor
- Anthropic
- ElevenLabs
- Plaid
- OpenAI
- Vimeo
- Chromatic
- Cvent
- Canva
- OpsGenie
- Sentry
- Vercel
Negotiation Insights
- Anthropic customers are scaling spend quickly, negotiate volume tiers and price caps now before you grow into higher brackets.
- OpenAI's growth-by-spend without growth-by-contracts means pricing power at renewal. Expect pushback on discounts.
- Some of these AI-Native companies are still getting their foot in the door with enterprise pricing norms, so there may be room to negotiate.
Contract Terms Trends
The shift toward mid-range commitments is accelerating and vendors are successfully pushing for longer commitments, and buyers are accepting them, likely in exchange for pricing concessions.
Contract Terms by Term Length
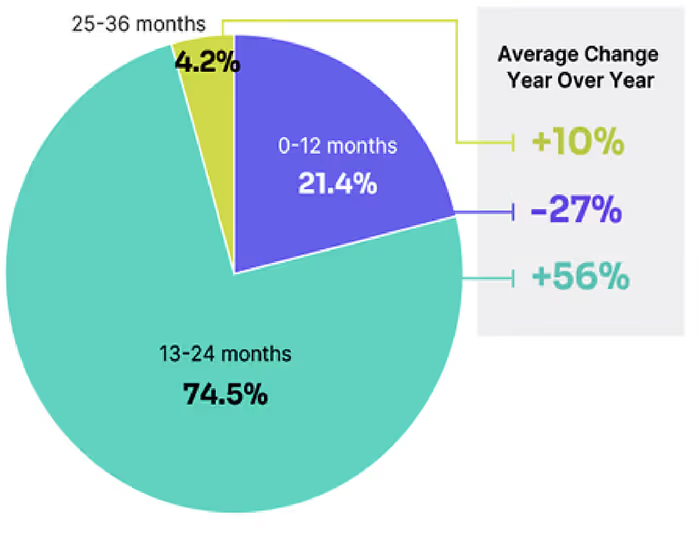
Additional Insight
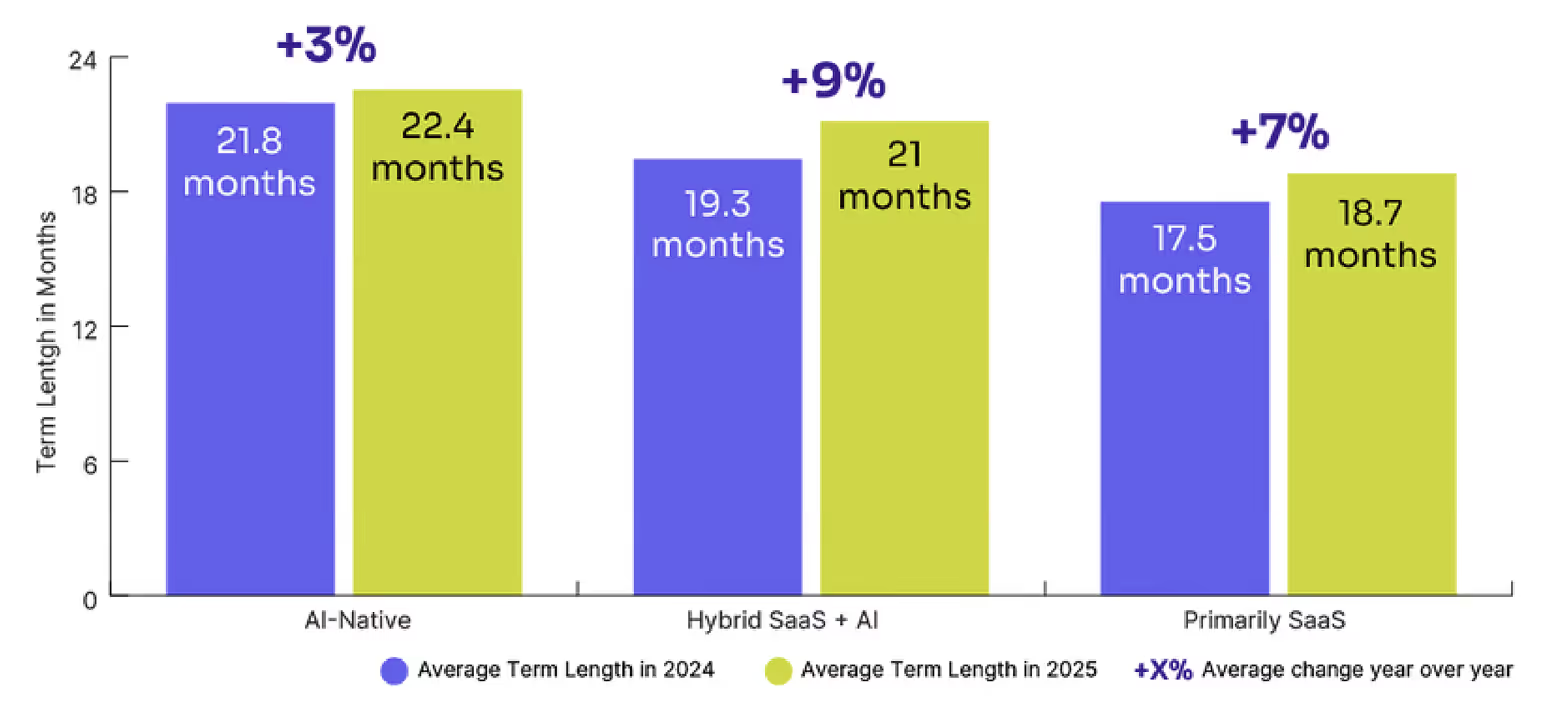
By AI category, the pattern is consistent but the baseline differs:
- AI-Native tools command the longest average terms (22.4 months)—buyers are betting on these relationships
- Hybrid SaaS + AI saw the largest term increase (+8.7% YoY)
- Primarily SaaS remains the shortest average term (18.7 months)—buyers are hedging
Contract Terms by AI Category
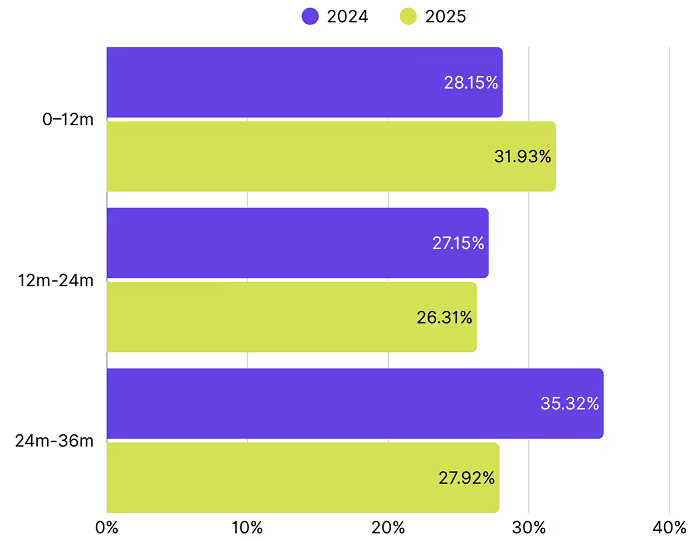
Discounts by Contract Terms
The discount data complicates the "longer term = better deal" assumption. In 2025, the deepest discounts came from short-term contracts (31.9%), while 12-24 month deals averaged just 26.3%. Now, this is in stark difference to 2024, so we'll have to watch if this is a true shift, or an anomaly. Are suppliers more willing to discount short-term deals, knowing product development is accelerating so much with AI, the uplift they can get at renewal is more important to target.
Average Discount Percentage by Term Length Bucket by Year
Negotiation Insights
- Only accept longer terms if you're getting meaningful concessions: price caps, favorable overage terms, or flexibility on seat adjustments. A 3-year deal at 10% off isn't better than a 1-year deal at list if the tool doesn't scale with you.
- For AI-Native tools, vendors are starting to expect longer commitments. Use this as leverage to secure strong price protection, annual uplifts should be capped at 3-5%.
- If you're being pushed toward 24+ month terms and you're uncertain about the tool's fit, counter with a shorter initial term and an option to extend at predetermined rates.
Discount Heatmap: Quantity vs. Term Length
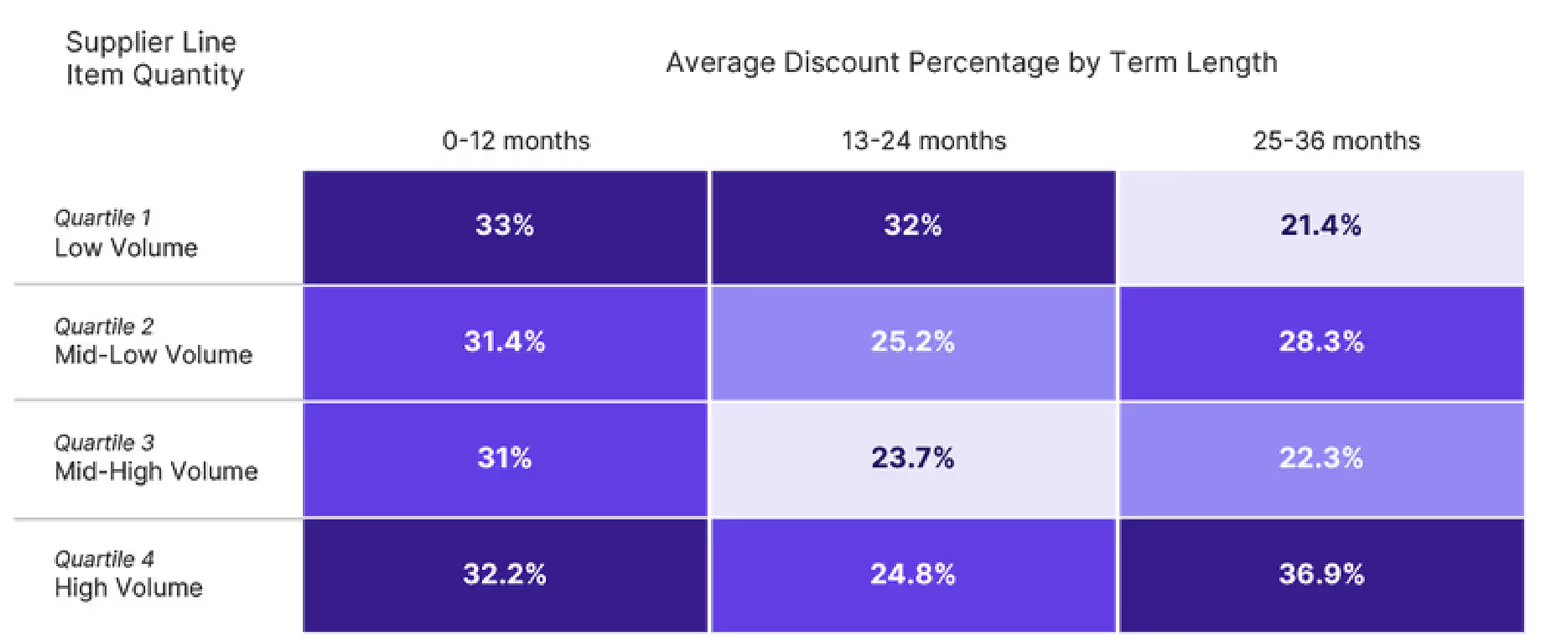
*To account variations in unit qunatity, we computed custom quantity buckets per supplier line item, using quartiles (Q1–Q4). This approach ensures that comparisons across suppliers are fair and meaningful — categorizing orders from low to high volume relative to each supplier’s own scale.
Top Suppliers Creating Shadow IT Problems
Top Suppliers Driving Shadow Spend by $$
.avif)
Market Insights
Shadow spend shows up in two ways, and understanding both matters.
- By dollar amount, the exposure is in operational infrastructure like Google, New Relic, Rippling, Circle. These aren't rogue tool purchases, they're core business systems that scaled outside proper visibility.
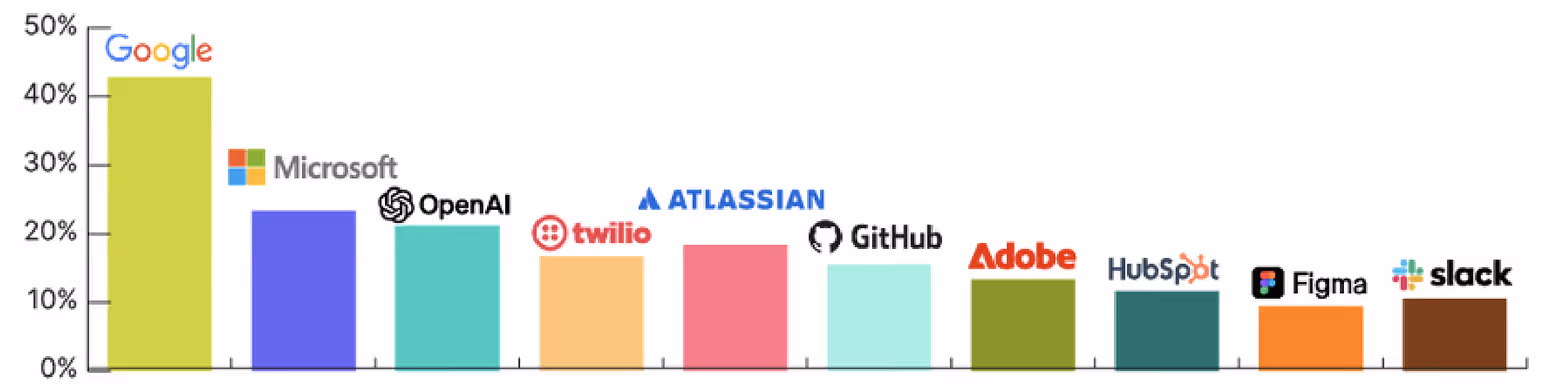
- By frequency, it's the platforms designed to bypass procurement: Google, Microsoft, OpenAI, Atlassian, etc. These tools share a common playbook—cloud usage auto-scales, productivity suites are self-serve, AI is embedded in existing workflows, and freemium tiers make credit card adoption easy.
Shadow spend isn't one problem, it's high-value contracts signed outside procurement and lots of smaller purchases that add up.
What Suppliers Are Driving Shadow Spend Most (by Frequency)
Negotiation Insights
- High-frequency shadow spend suppliers need proactive governance, not reactive cleanup. Build pre-approved usage thresholds and automated alerts before spend becomes material.
- Consider shadow spend frequency when evaluating vendors. A tool that's easy for teams to adopt without approval will be easy for them to expand without approval. Factor governance into your total cost of ownership.
Spend Variance
Top Spend Variance Drivers
Market Insights
- Spend variance is the gap between contracted amounts and actual spend. This clusters around a specific type of vendor: usage-based pricing models.
- The top variance drivers (Google, LinkedIn, Cursor, JetBrains, MongoDB, OpenAI, Twilio, AWS) share common traits: consumption pricing, overage structures, or variable licensing that makes forecasting difficult.
- The forecasting challenge is real: Finance teams can negotiate a $100K contract and end up with a $140K bill. Or they can over-commit and watch utilization stay at 60%. Neither outcome is acceptable, but both are common.
Negotiation Insights
- For high-variance suppliers, negotiate spend caps or usage alerts as contract terms, not just pricing. A 20% discount means nothing if you overspend by 40%.
- Build quarterly true-up clauses into consumption-based agreements. This gives you regular opportunities to adjust commitments based on actual usage.
- If a vendor won't offer any cost predictability mechanisms, that's a signal about their priorities. Consider whether alternatives exist that offer more transparent pricing.
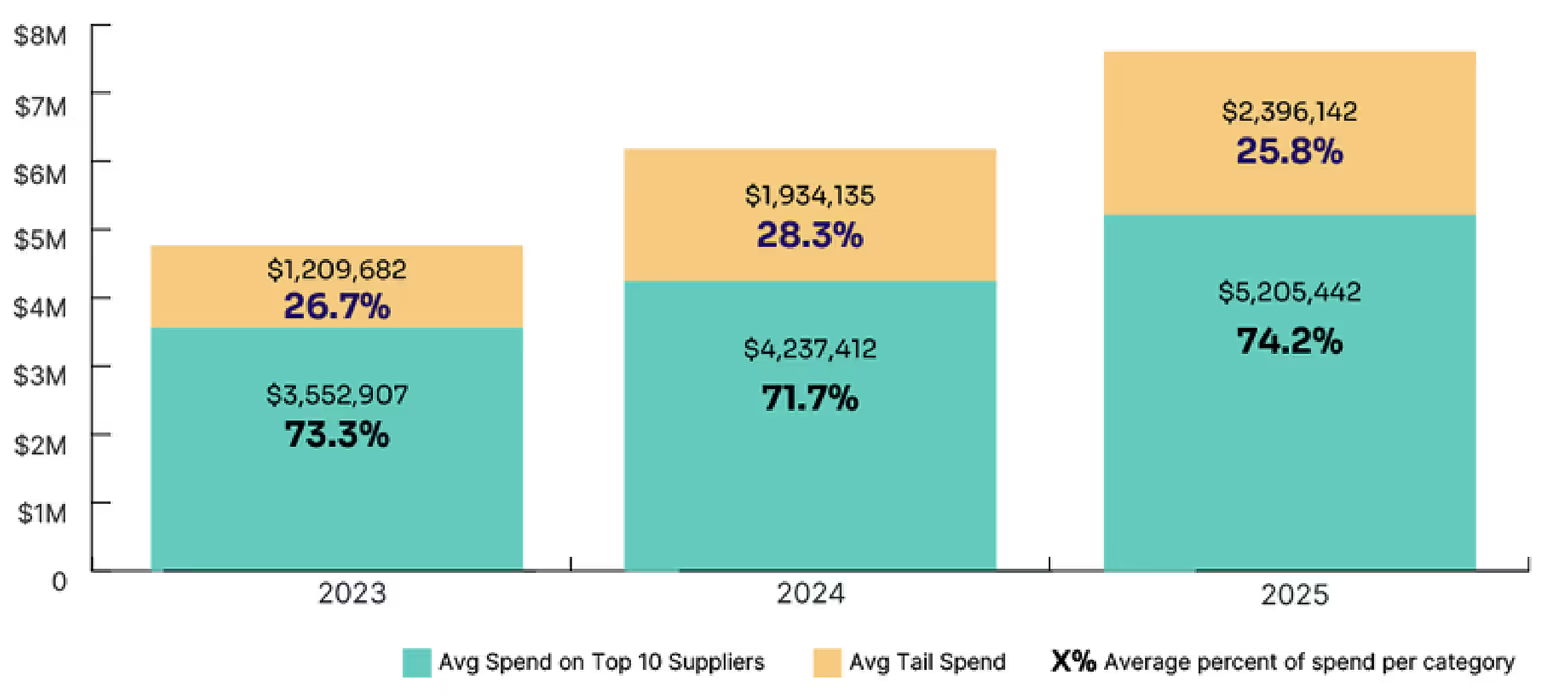
Supplier Spend Concentration
Despite all the noise about AI experimentation and tool proliferation, the fundamental spend distribution hasn't shifted dramatically:
- Your top 10 suppliers still command nearly three-quarters of your software budget.
- The long tail has actually shrunk slightly as a share of spend, even as AI tools proliferate.
What this tells us: The strategic suppliers that dominated in 2023 still dominate in 2025. AI spend is growing within the top 10 as much as outside it. Microsoft, Google, and Salesforce are all capturing AI budget (and buying AI-Native companies to do so).
Average Spend Across Top Suppliers vs. Tail
Negotiation Insights
- Your top 10 vendors deserve top-tier attention. These relationships represent the majority of your spend and your negotiation leverage, so treat them accordingly.
- Long tail experimentation is healthy, but set clear graduation criteria. When does a $10K AI tool become a $100K strategic investment? Define the threshold before you hit it.
- Consolidation within your top 10 may be more valuable than adding new vendors. If you're using Salesforce, Microsoft, and Google, you likely have overlapping capabilities, and potential bundle leverage, you're not exploiting.

Download Report PDF